Question the meaning
What is the claim? Does the explanation match the evidence? Which words or assumptions need checking?
EESP Quantum Systems / Public Learning Atlas
Can we understand the world as well as our machines can describe it? Explore global education evidence, investigate quantum science, and discover what it means to think scientifically.
“We have built machines that can answer questions in seconds. But are we developing generations capable of questioning those answers?”
Select an education indicator, explore countries, and compare results. Click a country, use the country finder, or navigate with your keyboard.
Most recent reported year per location; not a same-year ranking.
Choose up to three countries on the map. Bars start at zero (0-100% for literacy; 0-650 for PISA). Read the year beside each value before drawing conclusions.
Select a country and choose Add to comparison to begin.
Methods: The map covers Natural Earth country boundaries. Adult literacy is each location's most recent World Bank/UNESCO UIS observation, rounded to whole percentages. Many years differ; missing values are explicitly marked. PISA displays seven selected education systems, not all participating countries, and measures 15-year-olds in 2022. Literacy is not identical to advanced reading, mathematical reasoning, or intelligence.
Methodology and data →A guided science film for curious young learners: atoms, interference, qubits, entanglement and how to test ideas without confusing research hypotheses with established physics.
After the film / Beyond the answer
A convincing answer is a starting point, not the finish line. Can you explain it in your own words, read the evidence behind it, and test it on a different problem?
The film invites you to do that with quantum science. The education evidence below asks a larger question: are learners getting the knowledge and opportunities they need to reason independently? EESP's goal here is to make difficult ideas approachable without replacing understanding with memorisation.
No timer, account or personal information. This is practice with explanations, not an IQ test or an official PISA assessment. Younger learners can work alongside an adult.
Choose a chapter to move the player. Playback remains under your control.
What is the claim? Does the explanation match the evidence? Which words or assumptions need checking?
Check units, proportions and uncertainty. A percentage, a headcount and a test score answer different questions.
Say what you expect, compare fairly, and look for a result that could change your mind.
Plan a sequence, test each step, find the mistake and improve your method. The explanation matters as much as the answer.
The research image / PISA 2025
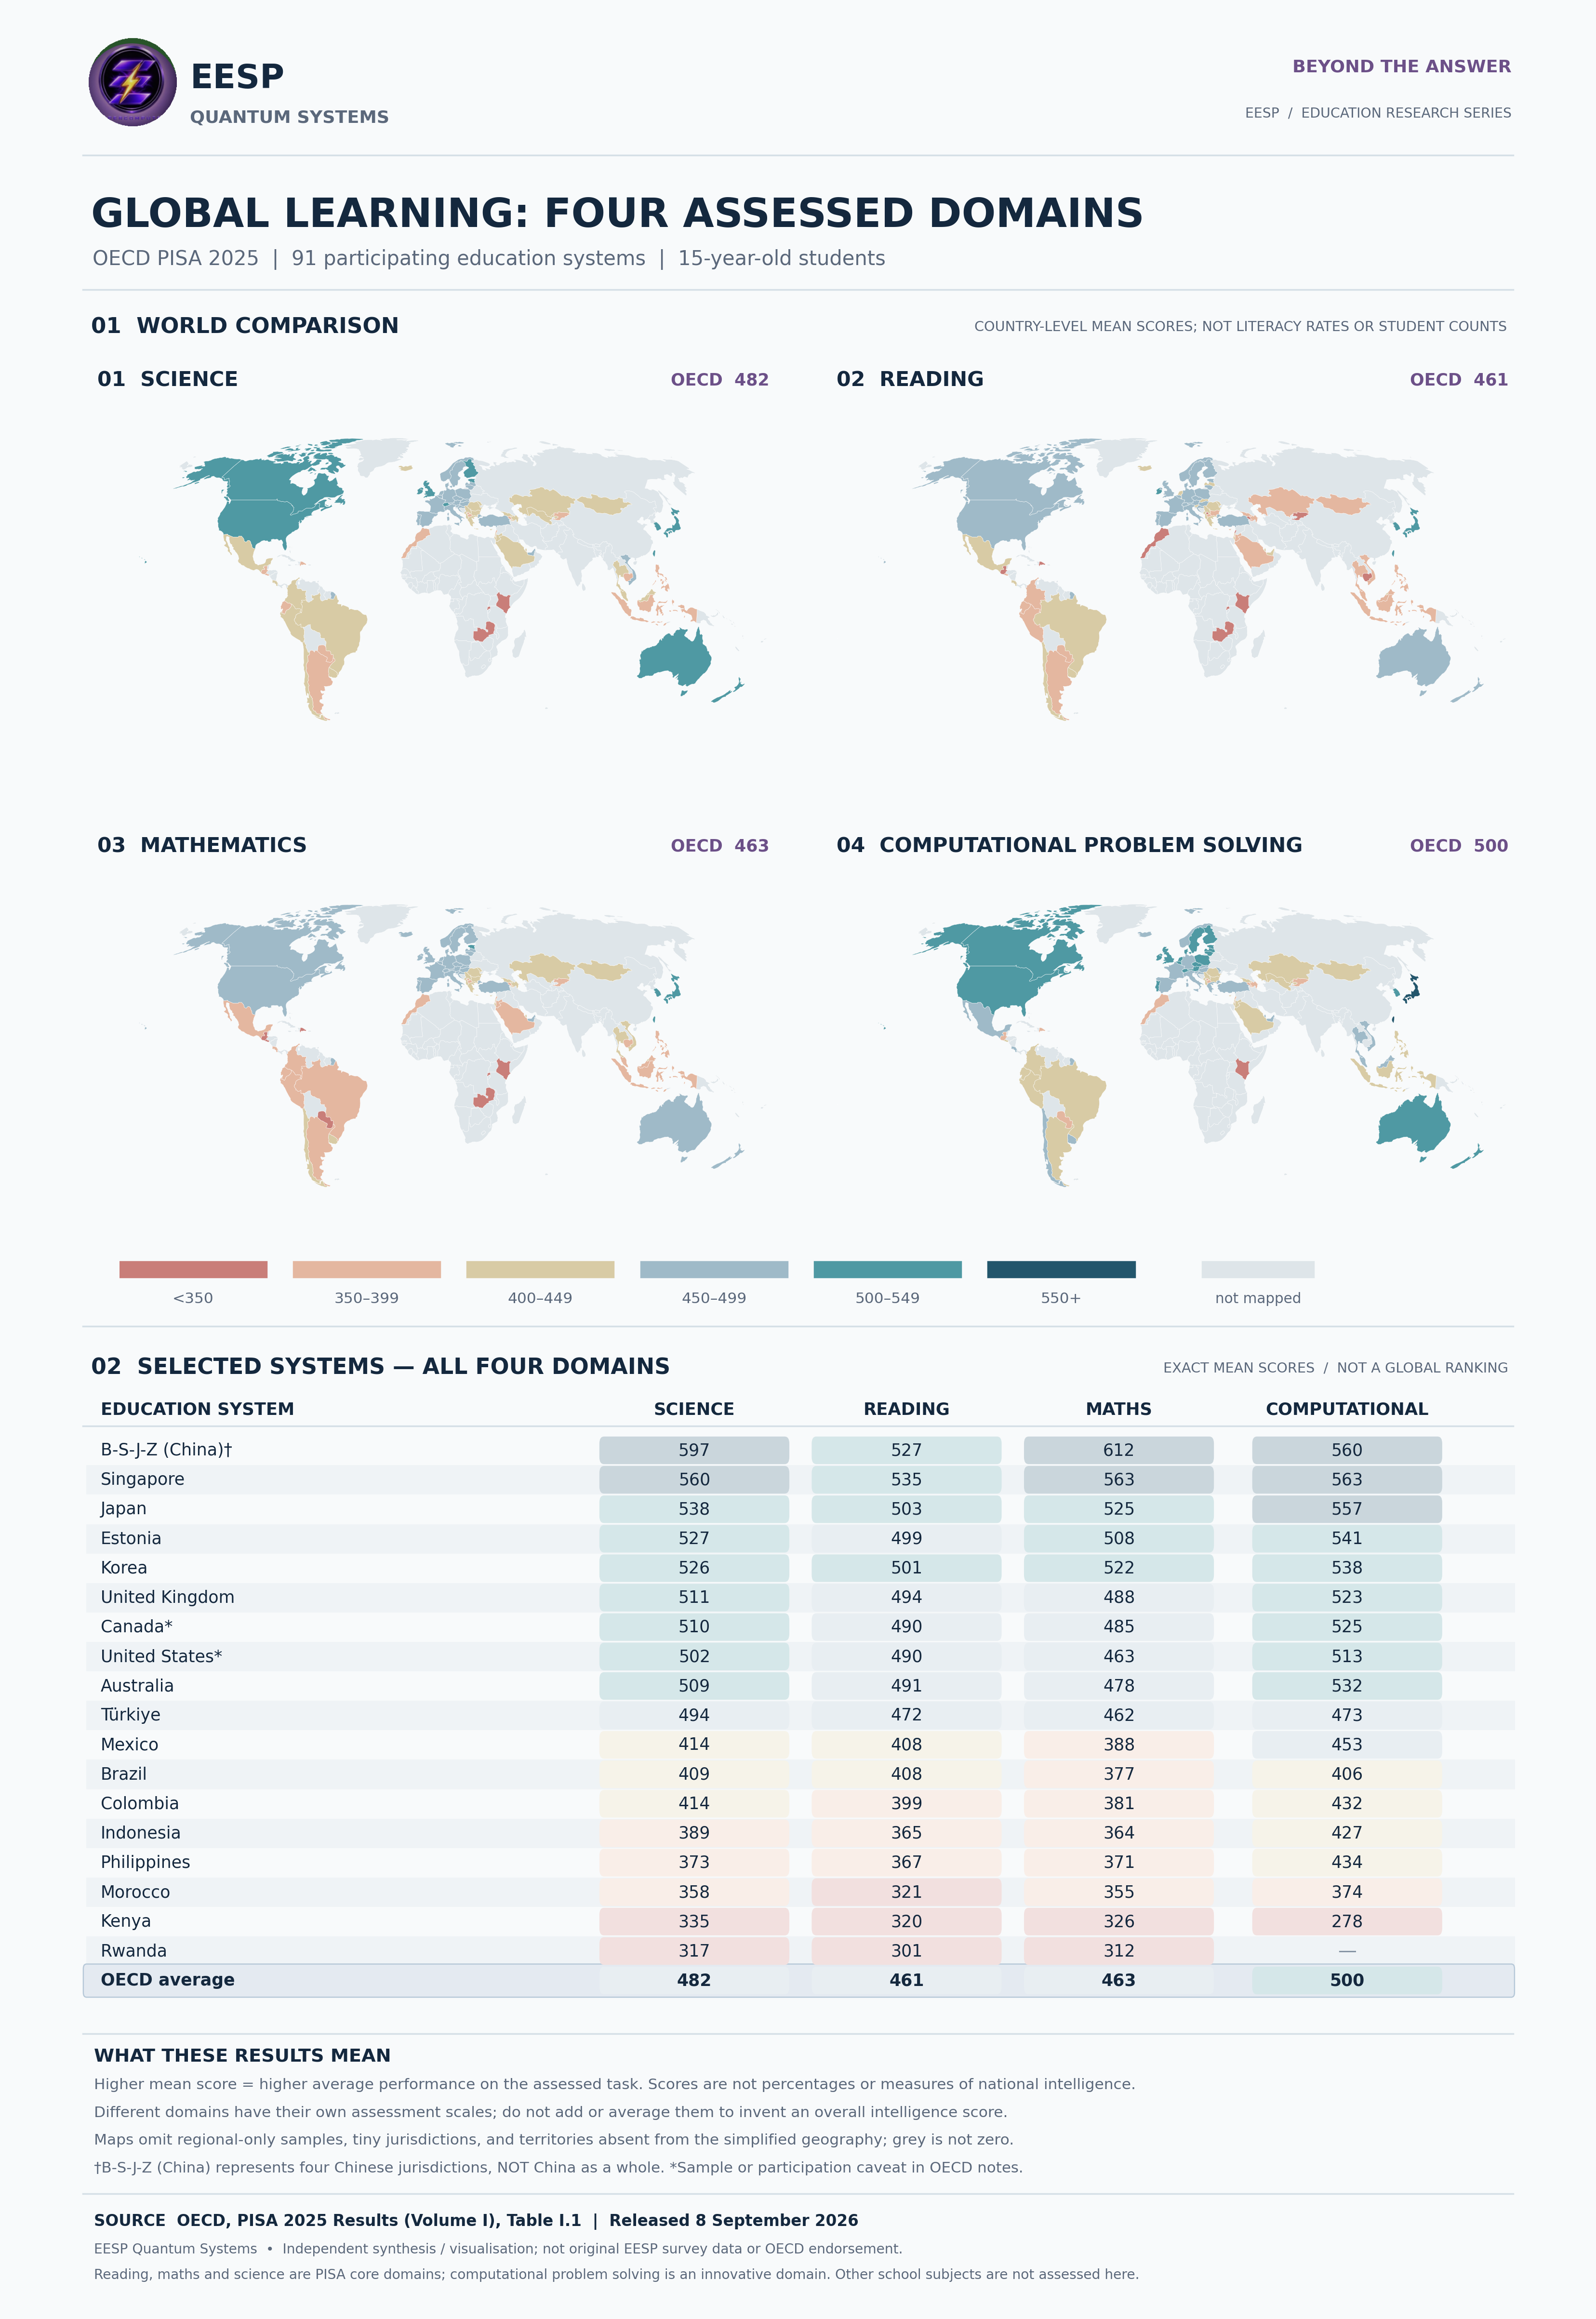
These are mean scores on specific assessments. They are not literacy percentages, counts of children, or measures of a nation's intelligence. The OECD benchmark is not a world average.
Compare the same subject and year. The domains have different scales; do not combine them into one intelligence score. Small score gaps may be uncertain. The controls below do not test statistical significance.
Regional results remain regional. B-S-J-Z (China) is not all of China. Some small or regional systems are absent from the simplified maps; grey does not mean zero.
If one system scores 535 in reading, does that mean 53.5% of children can read? Check the unit before deciding.
The map above the film is the separate 2022 comparison. This panel uses the 2025 source shown in the image; years are not silently combined.
91 education systems and an OECD reference. Select one domain; compare two systems without turning averages into labels for individual learners.
92 rows including the OECD average.
| Education system | Science | Reading | Mathematics | Computational problem solving |
|---|---|---|---|---|
| OECD average | 482 | 461 | 463 | 500 |
| B-S-J-Z (China) [regional] | 597 | 527 | 612 | 560 |
| Singapore | 560 | 535 | 563 | 563 |
| Macao (China) [jurisdiction] | 541 | 501 | 549 | 572 |
| Chinese Taipei | 540 | 508 | 546 | 551 |
| Japan | 538 | 503 | 525 | 557 |
| Estonia | 527 | 499 | 508 | 541 |
| Korea | 526 | 501 | 522 | 538 |
| United Kingdom | 511 | 494 | 488 | 523 |
| Canada* | 510 | 490 | 485 | 525 |
| New Zealand* | 509 | 497 | 480 | 531 |
| Australia | 509 | 491 | 478 | 532 |
| Finland | 504 | 474 | 469 | 507 |
| United States* | 502 | 490 | 463 | 513 |
| Switzerland | 501 | 470 | 499 | 520 |
| Ireland | 500 | 500 | 480 | 511 |
| Austria | 497 | 467 | 477 | 509 |
| Hong Kong (China) [jurisdiction] | 496 | 480 | 522 | 545 |
| Poland | 495 | 482 | 484 | 507 |
| Türkiye | 494 | 472 | 462 | 473 |
| Czechia | 490 | 468 | 477 | 517 |
| Belgium | 490 | 466 | 480 | 508 |
| Lithuania | 488 | 464 | 470 | 512 |
| Germany | 486 | 465 | 464 | 498 |
| Netherlands* | 485 | 441 | 483 | 506 |
| Sweden | 485 | 466 | 464 | 503 |
| Slovenia | 484 | 445 | 460 | 486 |
| France | 483 | 456 | 458 | 497 |
| Italy | 483 | 474 | 468 | 490 |
| Portugal | 482 | 462 | 460 | 501 |
| Hungary | 480 | 452 | 459 | 495 |
| Denmark | 478 | 460 | 471 | 506 |
| Spain | 477 | 451 | 457 | 499 |
| Croatia | 476 | 453 | 455 | 464 |
| Slovak Republic | 475 | 448 | 469 | 497 |
| Luxembourg | 474 | 443 | 458 | 506 |
| Norway* | 470 | 453 | 452 | 491 |
| Latvia | 468 | 430 | 460 | 507 |
| United Arab Emirates | 458 | 433 | 453 | 476 |
| Viet Nam | 457 | 392 | 443 | 461 |
| Malta | 453 | 415 | 439 | 463 |
| Ukrainian regions (17 of 27) [regional] | 448 | 418 | 431 | 478 |
| Uruguay | 445 | 423 | 405 | 462 |
| Chile | 442 | 436 | 403 | 466 |
| Israel | 442 | 436 | 433 | 444 |
| Iceland | 441 | 422 | 450 | 490 |
| Brunei Darussalam | 439 | 426 | 435 | 496 |
| Mauritius | 438 | 405 | 407 | Not reported |
| Uzbekistan | 438 | Not reported | Not reported | 402 |
| Montenegro | 435 | 418 | 411 | 423 |
| Albania* | 435 | 408 | 433 | 437 |
| Qatar | 434 | 418 | 416 | 452 |
| Greece | 434 | 423 | 424 | 461 |
| Thailand | 432 | 392 | 407 | 476 |
| Serbia | 429 | 415 | 417 | 437 |
| Romania | 425 | 413 | 419 | 442 |
| Mongolia | 424 | 374 | 419 | 443 |
| Costa Rica | 424 | 416 | 387 | 452 |
| Georgia | 422 | 384 | 416 | 413 |
| Moldova | 422 | 404 | 410 | 452 |
| Bulgaria | 421 | 387 | 405 | 425 |
| Kazakhstan | 420 | 385 | 414 | 449 |
| Malaysia | 419 | 393 | 397 | 484 |
| Colombia | 414 | 399 | 381 | 432 |
| Mexico | 414 | 408 | 388 | 453 |
| Saudi Arabia | 413 | 387 | 390 | 426 |
| Cyprus | 411 | 379 | 412 | 427 |
| Azerbaijan | 409 | 374 | 422 | 388 |
| Brazil | 409 | 408 | 377 | 406 |
| Jordan | 407 | 363 | 388 | 408 |
| Peru | 406 | 390 | 382 | 436 |
| Ecuador | 393 | 385 | 366 | 422 |
| Argentina | 393 | 389 | 367 | 403 |
| Indonesia | 389 | 365 | 364 | 427 |
| El Salvador | 385 | 366 | 346 | 401 |
| Cambodia | 382 | 347 | 366 | Not reported |
| North Macedonia | 378 | 357 | 380 | 389 |
| Philippines | 373 | 367 | 371 | 434 |
| Lebanon | 372 | 331 | 377 | 358 |
| Armenia | 369 | 348 | 376 | 354 |
| Kyrgyzstan | 363 | 344 | 364 | 388 |
| Dominican Republic | 361 | 346 | 339 | 379 |
| Palestinian Authority | 359 | 350 | 354 | 393 |
| Morocco | 358 | 321 | 355 | 374 |
| Kosovo | 357 | 340 | 350 | 359 |
| Paraguay | 355 | 352 | 334 | 352 |
| Kurdistan Region (Iraq) [regional] | 352 | 312 | 339 | Not reported |
| Guatemala | 351 | 337 | 334 | 369 |
| Zambia | 337 | 325 | 314 | Not reported |
| Kenya | 335 | 320 | 326 | 278 |
| Dushanbe (Tajikistan) [regional] | 334 | 368 | 382 | Not reported |
| Rwanda | 317 | 301 | 312 | Not reported |
* Sampling caution in the source table. Regional and jurisdiction labels are retained. Confidence intervals are not included in this extract; consult OECD before making ranking or significance claims.
Download the source transcription (CSV) ↓Why this matters
Being in school, reading a simple statement and solving an unfamiliar problem are different achievements. These indicators describe different populations and periods: do not add them together or use one as a substitute for the others.
Out of school globally, from primary through upper-secondary school age. This is an access measure, not a count of children who cannot read.
UNESCO GEM 2026 ↗Global adult literacy rate. Basic reading and writing are foundational, but this percentage does not measure advanced reasoning or every child's skills.
UNESCO literacy evidence ↗Minimum reading / mathematics proficiency at the end of primary school. UNESCO flags these estimates as outdated; they are not 2026 measurements.
Read the data-age warning ↗Our response is an educational design to try: make knowledge accessible, offer worked explanations, invite an independent attempt, and give useful feedback. These world statistics do not prove that this website improves learning. That requires its own evaluation.
In a 2025 high-school mathematics trial, an unguided AI assistant helped while available, but subsequent unaided grades were 17% lower than the no-AI group's. Learning-focused safeguards largely mitigated that effect. This is a relative grade difference in one study, not a worldwide loss of intelligence.
Bastani and colleagues, PNAS ↗A separate 2025 college-physics trial reported greater learning in less time with a research-designed AI tutor than with in-class active learning. Its population and teaching design differ, so the two studies should not be pooled into a universal verdict about AI.
Kestin and colleagues, Scientific Reports ↗Try a learning-first routine: attempt the problem, request a hint or worked explanation, explain the method yourself, then try a new problem without the tool. Return later to see what stayed with you. Keep teachers and trusted adults involved.
Your turn / Think, test, explain
Practise reading evidence, using numbers and testing ideas. Make your own attempt before checking the explanation. A mistake points to something worth exploring; it does not define your ability.
Informal EESP practice, not a standardised test, IQ score or official PISA task. Your answers stay in this page's memory and disappear on reload. No account, names, tracking of answers or submission to a server.
These results describe this short practice only. Review an explanation, try the linked lab, and explain a new example without help. A repeat of these same questions is practice, not independent proof of improvement.
Education data: OECD and UNESCO. Research graphic: EESP compilation of external data, not original EESP survey results or source-organisation endorsement. Practice activities: original EESP educational content. Sources and measurement notes ↓
Education is more than memorizing facts. Build intuition across mathematics, physical science, living systems and computation by changing variables and inspecting what happens.
Make predictions about Fibonacci structure, modular cycles, and what makes a pattern convincing.
Open lab → 02 / physicsPlay with state preparation and measurement instead of relying on mystical metaphors.
Open lab → 03 / chemistryExplore how arrangement, binding and energy landscapes change what matter does.
Open lab → 04 / life sciencesConnect cells, feedback, diffusion and self-organization to measurable processes.
Open lab → 05 / astronomyExplore gravity, stellar structure and the origin of the elements around us.
Open lab → 06 / computationDiscover uncertainty, measurement, error correction and the limits of information.
Open lab →The map is a place to formulate questions, not a league table for judging children, cultures or intelligence. Check definitions, dates, sampling and coverage before drawing conclusions.
World Bank indicator SE.ADT.LITR.ZS concerns reading and writing a simple statement among people aged 15+. It is not a test of advanced mathematics or science. Countries report in different years and use differing survey methods.
OECD PISA measures 15-year-old students' performance in mathematics, reading and science. The seven systems shown are a selected comparison, with an OECD-average reference; some PISA samples require interpretive caution.
OECD PISA 2022 report ↗Ask about access, resources, learning conditions, students outside school, and uncertainty. An observed difference does not establish what caused it. Practice forming hypotheses and looking for counterexamples.
Download the source snapshot ↓